August 2026 Dallas Market: The Scramble Settles

July scrambled the hierarchy. August didn't put it back together — it sent all three segments down separate lanes. The one that took July off went back to work. The one drifting down kept drifting, but grew a complication underneath. And the market everyone had written off a month ago didn't just firm — it finished the job. Three segments, three trajectories, no longer telling one story. And for the first time in a while, financing has nothing to add.
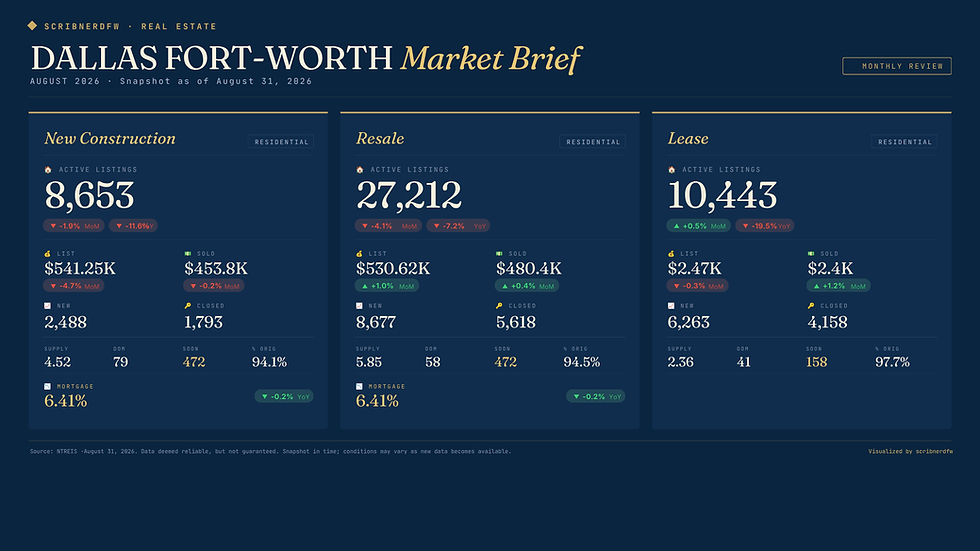
After June's plateau broke and July's 30-basis-point jump introduced a real financing headwind, August called a truce. The average rate held flat at 6.41%, exactly where July left it. The climb paused. The annual math still favors buyers — roughly 16 basis points under year-ago levels — so the tailwind is intact even if it has stopped building. For the first time in two months, rates are neither the story nor the villain. They are simply steady.
New Construction: The Breather Ends
July was the pause. August was builders getting back to it. The volume that dropped out in July came partway back, inventory rebuilt, and pricing held its ground.
Closed sales recovered 2.7% month over month to 193, and new listings climbed 6.4% to 398 — both reversing July's retreat. Active listings actually grew for the first time in months, up 5.3% to 1,096, and the year-over-year inventory deficit narrowed from July's steep 23.2% to a still-tight 16.6%. Builders held the line on price: the average sold price ticked up 0.8% to $747.1K and now sits a striking 14.4% above year ago — the widest annual premium of any segment in the county. Days on market held at 58, and builders captured 96.0% of original.
The most telling move is in the list line. The average list price dropped 15.7% to $864.10K, collapsing the gap between ask and sold from roughly $240K in July to about $117K now. That is the pricey standing inventory the spring briefs kept flagging finally working its way through — the mix is normalizing, not the market weakening. Read together, this is a segment coming back online: volume firming, inventory rebuilding off historic lows, and prices holding. The breather is over.

Key New Construction Indicators:
Active Listings: 1,096 (▲ 5.3% MoM; ▼ 16.6% YoY)
Avg List Price: $864.10K (▼ 15.7% MoM; ▼ 8.5% YoY)
Avg Sold Price: $747.1K (▲ 0.8% MoM; ▲ 14.4% YoY)
New Listings: 398 (▲ 6.4% MoM; ▼ 7.7% YoY)
Closed Sales: 193 (▲ 2.7% MoM; ▼ 15.7% YoY)
Resale: The Slide Grows a Gap
Resale's sold price has now fallen three months running, but August added a wrinkle the two prior months didn't have: sellers started asking for more, not less.
The average sold price slipped another 3.3% month over month to $543.7K — the third straight monthly step down. The twist is in the annual column: it is now 3.3% above last August, flipping the year-over-year line back into positive territory after July printed a decline. Meanwhile the average list price didn't ease — it jumped 11.9% to $611.05K and now runs 10.9% above year ago. For the first time this cycle, the average ask sits well above the average sale. Homes are still closing at 94.5% of original, but that ratio slipped from July's 95.1%, and volume took a real hit: closed sales fell 16.3% to 1,360 and new listings dropped 14.7% to 2,282. Active inventory eased 2.8% to 6,709. Days on market held at a quick 46.
The read: some of the list-price jump is mix — with new listings down sharply, what's coming to market skews higher-end — but the direction of travel is a widening gap between seller expectation and buyer follow-through. Timelines are still fast and the market still functions, but the easy, orderly glide of the last two months now has friction in it. Price to what August closed at, not to what August asked.

Key Resale Indicators:
Active Listings: 6,709 (▼ 2.8% MoM; ▼ 8.1% YoY)
Avg List Price: $611.05K (▲ 11.9% MoM; ▲ 10.9% YoY)
Avg Sold Price: $543.7K (▼ 3.3% MoM; ▲ 3.3% YoY)
New Listings: 2,282 (▼ 14.7% MoM; ▼ 10.1% YoY)
Closed Sales: 1,360 (▼ 16.3% MoM; ▼ 9.5% YoY)
Lease: The Comeback Completes
July answered the rent question on the monthly line. August answered it on the annual line — the one that had been the segment's lingering asterisk all summer.
The average sold lease rose another 2.0% month over month to $3.2K, a second consecutive monthly gain. More importantly, it is now 1.7% above year ago — the annual comparison the June and July briefs kept flagging as underwater has finally surfaced. List prices eased slightly, down 0.8% to $3.06K, but landlords still captured 97.5% of original, the strongest sold-to-list ratio in the county for another month running. The supply squeeze that powers all of it deepened: active listings fell 22.2% year over year to 2,890.
The one asterisk that remains sits in volume. Closed leases fell 6.4% to 1,095 and are down 10.5% year over year, and months of supply ticked up to 2.75. So the landlord case is now complete on price — monthly and annual both green — but the transaction count keeps thinning underneath it. The leverage is real and now fully validated by the comps. The activity is quieter than the pricing implies.

Key Lease Indicators:
Active Listings: 2,890 (▼ 1.1% MoM; ▼ 22.2% YoY)
Avg List Price: $3.06K (▼ 0.8% MoM)
Avg Sold Price: $3.2K (▲ 2.0% MoM; ▲ 1.7% YoY)
New Listings: 1,656 (▼ 4.3% MoM; ▼ 11.1% YoY)
Closed Leases: 1,095 (▼ 6.4% MoM; ▼ 10.5% YoY)
Strategic Outlook: Three Lanes
July scrambled one leader into a three-way tie. August didn't crown a new leader — it sent all three down separate roads.
New construction moves from price-disciplined pause back to functioning strength. Volume returned, inventory rebuilt off historic lows, prices held, and the bloated list line finally normalized. It is no longer the runaway of June or the wallflower of July — it is a healthy, tight, firmly-priced segment doing steady business.
Resale extends its slide, now with friction. The sold line has fallen for three months, but the story shifted: asks jumped while sales eased, opening the widest ask-to-sold gap of the cycle, and volume dropped hard on both sides of the ledger. The market still clears quickly, but sellers and buyers are further apart than they have been.
Lease completes its recovery. Rents rose again, the annual line turned positive, and the sold-to-list ratio still leads the county. The only shadow is a transaction count that keeps shrinking. Structurally, this is the strongest hand in the county — thin, tight, and now fully backed by the comps.
And beneath all three, financing went quiet. Rates held at 6.41%, still favorable against last year, no longer moving in either direction. For one month at least, the market's direction is being set by supply and demand alone.
Actionable Intelligence
For Agents: New construction is a strength pitch again, and this month you can lead with both scarcity and momentum — inventory is still down 16.6% year over year, but volume and pricing both firmed, so the segment reads as healthy rather than merely tight. In resale, the ask-to-sold gap is the whole conversation: sellers are asking 11.9% more month over month while sold prices fell again, so your job is to anchor listing prices to what August actually closed at, not to the aspirational asks flooding the MLS. Buyers who see that gap have room to negotiate — use it. In lease, the landlord message is now fully earned, up monthly and annually, so quote the number with confidence, but keep leaning on the supply story because that is what is durable.
For Investors: New construction volume recovered without any price give, so entry is firm, not cheap — you are buying into strength, not a dip. On lease, the annual line finally turned green (+1.7%), which validates the structural thesis, but underwrite the thinning volume, not the rent headline: closed leases are down 10.5% year over year even as pricing firms. The supply squeeze is the real asset; the rent number is just now catching up to it. In resale, the widening ask-to-sold gap and the 16.3% drop in closed sales signal seller-buyer friction — patient capital may find better-negotiated entries than the list prices suggest.
For Buyers: Rates held at 6.41% — the financing window didn't widen this month, but it didn't close either, and it is still about 16 basis points better than a year ago. In new construction, inventory rebuilt a little and pricing is firm, so competition is about finding the right unit, not out-bidding on price. In resale, this is your moment: sellers are asking more while the market is paying less, homes still close in about six and a half weeks, and the gap between list and sold is the widest it has been. Don't chase the ask — make your case from the sold data.
For Sellers: Resale sellers, the MLS is full of ambitious asks right now, but sold prices fell for a third straight month and the share of original captured slipped to 94.5%. Pricing to the aspirational number is how you sit; pricing to August's sold data is how you close. New construction sellers hold the firmest pricing in the county and momentum came back this month — lead with scarcity and condition. Lease sellers are in the best position all summer: rents are up on the month and finally up on the year, so ask with real confidence, just keep the number tethered to the tight supply that is actually driving it.
Important Note:
This analysis is based on data from NTREIS (North Texas Real Estate Information Systems) as of August 30,, 2026. Market conditions can change rapidly, and this report is intended for informational purposes only. It should not be considered a guarantee of future market performance.