
Why July's Slowdown in Rockwall Is Not the Warning It Looks Like

The Rockwall County market spent June building momentum. July spent it taking a breath. Last month every segment moved in the same direction at once, closings climbing right alongside prices while rates sat still. This month the pace eased. Mortgage rates ticked up to 6.11% in June's read and now sit at 6.41%, about 30 basis points higher month over month but still 16 below where they sat a year ago, and the summer transaction peak rolled over into a quieter late July.
Closings pulled back across all three segments, which is exactly what a normal seasonal cooldown looks like. What did not pull back was resale pricing, which firmed up even as volume slowed. New construction gave back June's price spike as its expensive completed inventory finished clearing, and the lease market stayed tight on supply while the average closed rent slipped on a lighter mix. Here is where things actually stand as of July 31, 2026.
New Construction: The June Spike Unwinds
New construction did in July what it always looked likely to do. June's eye-catching jump in average sold price was a mix shift, the pricey finished homes clearing all at once, and this month that effect reversed.
Inventory Activity: There are 425 active listings, up 3.9% from June but still 11.1% below a year ago. New listings held flat at 88 for the month and are down 26.1% year over year. The pipeline has stopped thinning for now, though it is still running well under last summer.
Pricing Trends: The average list price barely moved at $648.20K, off 0.1% for the month and up a strong 10.8% year over year. The average sold price fell back to $558.2K, down 11.1% month over month but still 4.8% above last July. That pullback is the story. Average sold has dropped back below average list, which is the normal relationship between the two, and it tells you June's high-end closings were a one-time clearing rather than a new price floor. Closings landed at 46, down 50.0% for the month and 48.9% year over year. Days on market improved to 95 and homes closed at 90.0% of original list. A buyer with patience still has real room to negotiate on a new build.

Key New Construction Market Trends:
Months Supply: 5.5
Days on Market: 95
Coming Soon: 13
Closed Sales: 46 (-50.0% MoM, -48.9% YoY)
Avg Sold Price: $558.2K (-11.1% MoM, +4.8% YoY)
Avg List Price: $648.20K (-0.1% MoM, +10.8% YoY)
Resale: Slower Pace, Full Price
Resale is where July held its ground. Volume came off the June high, but pricing did not blink, and the gap between what sellers asked and what buyers paid all but disappeared.
Inventory Levels: Active listings edged up to 819, 1.7% above June and 9.0% below last July. That year-over-year gap has been closing, from down 12.5% last month to down 9.0% now. New listings pulled back 10.0% for the month to 270 but are still up 14.4% against last year.
Closed Performance: The average list price eased 5.5% to $569.23K, essentially flat year over year at up 0.4%. The average sold price climbed again to $568.1K, up 4.3% for the month and 10.7% above last July. Those two numbers are worth putting side by side, because sold price is now sitting within about a thousand dollars of list price. Sellers took home 94.6% of original list, and homes averaged 61 days on market, a touch faster than June. Closed sales came in at 157, off 8.2% for the month but still up 15.4% year over year.
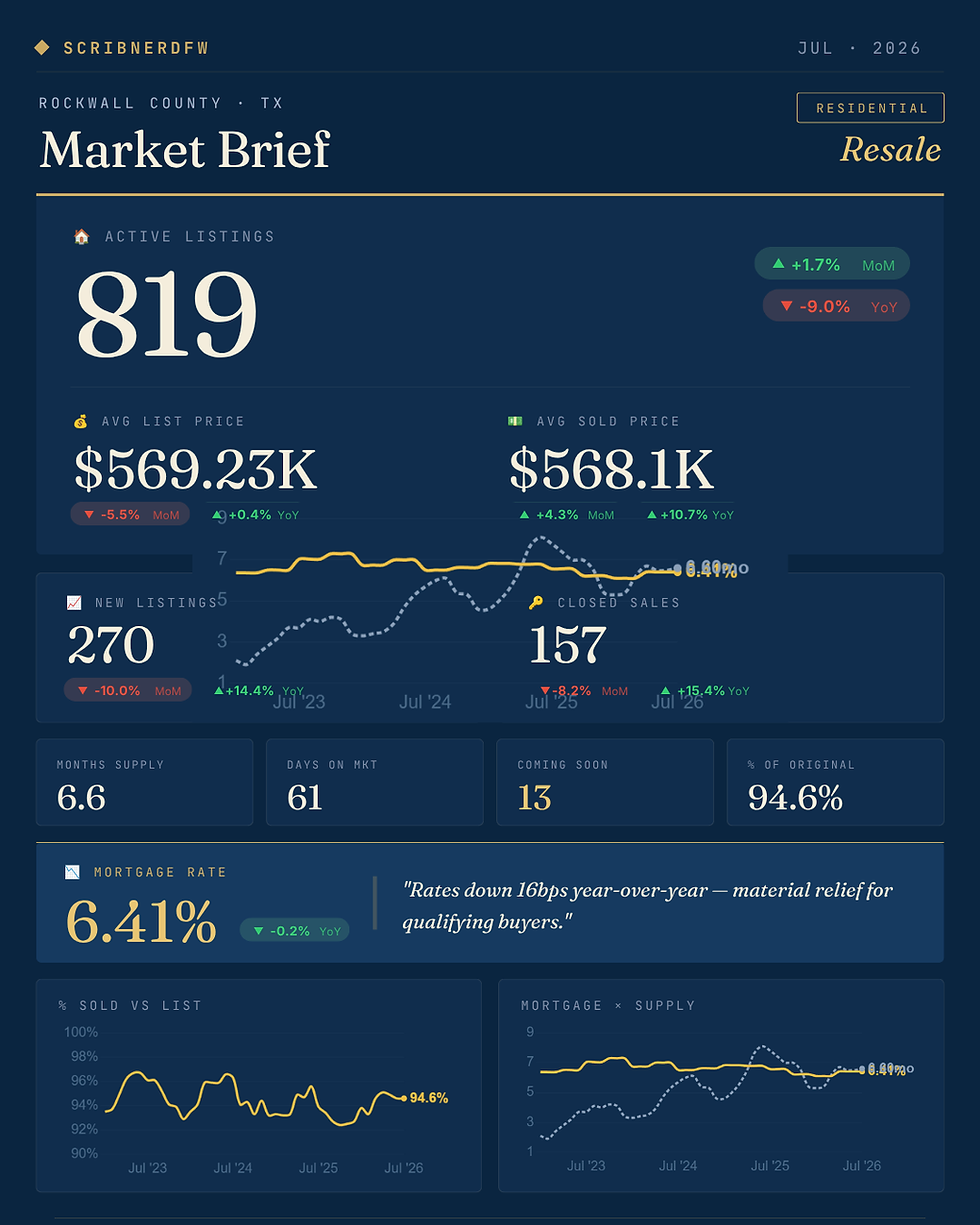
Key Resale Market Trends:
Months Supply: 6.6
Days on Market: 61
Coming Soon: 13
Closed Sales: 157 (-8.2% MoM, +15.4% YoY)
Avg Sold Price: $568.1K (+4.3% MoM, +10.7% YoY)
Avg List Price: $569.23K (-5.5% MoM, +0.4% YoY)
Lease: Tight Supply, Lighter Closes
The lease market kept its low-vacancy backdrop, but the headline rent number moved the other way this month, and the reason matters.
Supply and Demand: New listings dropped 14.7% month over month to 128 after June's summer surge and are down 15.8% year over year. Active listings slipped to 192, off 2.0% for the month and a steep 24.7% below last July. Closed leases came in at 95, down 8.7% from June but still 10.5% above last year. Months supply sits at just 1.8 with homes leasing in 46 days.
Lease Pricing: The average list price ticked up to $2.78K, 0.7% higher for the month. The average closed lease, though, fell to $2.3K, down 9.4% for the month and 13.7% year over year. With list prices rising while closed prices fall, that reads as a mix shift, smaller and lower priced units doing the leasing in July, rather than landlords cutting rents. Renters are still paying 97.6% of original ask, so there is very little negotiating daylight on any given home.

Key Rental Market Trends:
Months Supply: 1.8
Days on Market: 46
Coming Soon: 4
Closed Sales: 95 (-8.7% MoM, +10.5% YoY)
Avg Sold Price: $2.3K (-9.4% MoM, -13.7% YoY)
Avg List Price: $2.78K (+0.7% MoM)
Overall Market Outlook: A Seasonal Breather, Not a Turn
The defining theme for July 2026 is NORMALIZATION. Rates nudged up to 6.41%, the summer buying peak passed, and closings cooled across all three segments. None of that is a warning sign on its own. It is what late summer usually looks like after a strong June.
Resale is still the segment carrying the county, and it is doing it on price rather than volume now. Closings slowed month over month but stayed 15.4% ahead of last year, and with sold prices up 10.7% year over year and landing within a thousand dollars of list, well priced homes are still getting paid close to full ask. At 6.6 months of supply and 61 days on market, this remains a balanced market that rewards realistic pricing on day one.
New construction handed leverage back to buyers. The 11.1% drop in average sold price is June's mix shift unwinding, not a builder fire sale, but with 95 days on market and closings at 90.0% of original list, a buyer willing to wait out a builder is negotiating from a good spot.
The lease market is still the tightest corner of the county on vacancy, under two months of supply with homes leasing at 97.6% of ask. The dip in the average closed rent is about which units leased this month, not a softening in what landlords can command, and heading into the back half of the year the vacancy cushion is still thin.
The takeaway depends on which door you are walking through. Buyers have a bit more resale inventory to choose from than last summer and real leverage on new builds, though rates are no longer falling to help the math. Sellers still have pricing on their side, but the slower pace and 61 days on market mean the number has to be right from the start. Investors are looking at a rental market with almost no vacancy give, even if the average closed rent took a one-month step back.
If you want to talk through what this means for your specific situation, whether you are buying, selling, or investing in Rockwall County, let's connect.
Important Note:
This analysis is based on data from NTREIS (North Texas Real Estate Information Systems) as of July 31, 2026. Market conditions can change rapidly, and this report is intended for informational purposes only. It should not be considered a guarantee of future market performance.


