
Collin County Just Split Three Ways Again — And This Time Buyers Aren't the Ones Moving

The June 2026 Collin County data is a story about who is willing to move first. Mortgage rates held at 6.11% — still down 68 basis points year-over-year and still the steadiest tailwind in this market for anyone trying to qualify. But rates aren't the variable anymore. Supply is.
May was the month buyers answered the inventory build. June is the month the two sides of the market picked opposite responses to it. Builders pulled their listings and pushed their prices back up. Resale sellers did the reverse — kept listing, cut the ask, and let the closings speak. Landlords, quietly, took back the rate concession they gave up last month.
Where you sit — builder, resale buyer, seller, landlord, or tenant — still determines which way the leverage tilts. This month, it tilts differently in every segment.
New Construction: Builders Unblink
Last month builders blinked on price. In June they took it back. Average list price climbed to $526.36K, up 4.1% month-over-month and 2.8% year-over-year — the first positive YoY list print in this segment in a while. Average sold price followed, but only barely: $447.2K, up 0.7% MoM and still down 1.5% YoY.
That divergence matters. When the ask rises four points and the close rises less than one, the spread widens — and the spread is where negotiating room lives. New builds are closing at 92.8% of original list, down from last month, on 72 days on market, the slowest of any segment. Builders are asking more and waiting longer to get it.
The real signal is upstream. New listings collapsed to 666, down 13.4% MoM and 13.8% YoY. Builders aren't flooding the market — they're throttling it. Active inventory ticked down to 1,966 and months of supply sits at a manageable 3.4. That's supply discipline, and it's what's buying them the confidence to reprice.
Demand cooperated, at least month-to-month: closed sales rose to 577, up 5.3% MoM, though still down 2.0% YoY.

Key New Construction Metrics:
Active listings: 1,966 (-1.2% MoM, +0.1% YoY)
New listings: 666 (-13.4% MoM, -13.8% YoY)
Closed sales: 577 (+5.3% MoM, -2.0% YoY)
Average list price: $526.36K (+4.1% MoM, +2.8% YoY)
Average sold price: $447.2K (+0.7% MoM, -1.5% YoY)
The takeaway: builders are controlling the faucet, not the price tag. With listings down double digits and supply at 3.4 months, they have room to hold a firmer number. But the 92.8% execution and 72-day timeline say the room to negotiate is still real — it just moved back to the closing table. Ask for the incentives. They're there.
Resale: Sellers Take the Cut
Resale is where the leverage is loudest. Active listings climbed to 5,159, up 8.5% MoM, pushing months of supply to 5.8 — the deepest of the year and squarely a buyer's market.
Sellers responded the way a functioning market should: they cut. Average list price fell to $633.42K, down 3.2% MoM and 3.8% YoY. And it worked well enough. Average sold price rose to $626.6K, up 1.7% MoM — meaning homes are now closing at roughly 99% of the current ask and 95.8% of original. Sellers are getting close to their number. They're just arriving at that number after a haircut.
Volume held rather than surged: closed sales at 1,156, up 0.3% MoM but up 4.3% YoY. The demand that showed up this spring didn't leave — it just stopped accelerating. And the supply pipeline keeps easing: new listings at 1,991, down 6.8% MoM and 4.0% YoY. Accumulated inventory is high; incoming inventory is not.
Deals are still moving quickly at 44 days on market.
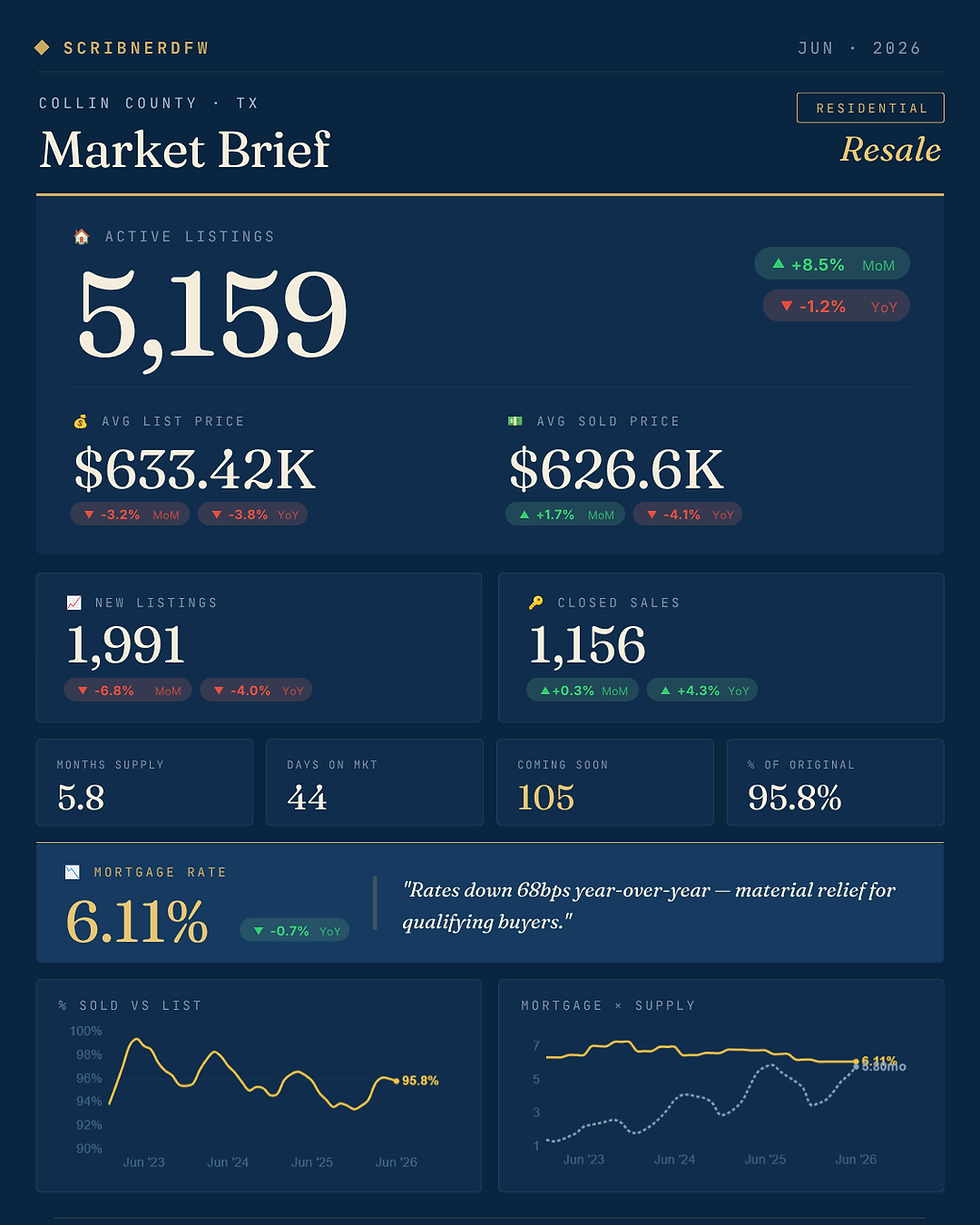
Key Resale Metrics:
Active listings: 5,159 (+8.5% MoM, -1.2% YoY)
New listings: 1,991 (-6.8% MoM, -4.0% YoY)
Closed sales: 1,156 (+0.3% MoM, +4.3% YoY)
Average list price: $633.42K (-3.2% MoM, -3.8% YoY)
Average sold price: $626.6K (+1.7% MoM, -4.1% YoY)
For buyers: the window is wider than it's been all year. 5,159 homes, 5.8 months of supply, sold prices down 4.1% YoY, and rates 68bps below last June. That is as much selection and as much leverage as this county has offered in a long time.
For sellers: the outcome data is better than the inventory number implies — 44 days, 95.8% of original, closings up YoY. But look at what earned it: a 3.2% cut in the ask. Price it right at launch and you get speed and a strong execution. Price it aspirationally and you become part of the 5,159.
Lease: Landlords Take the Rate Back
Last month tenants got a small opening on rate. June closed it. Average leased price rose to $2.6K, up 4.8% MoM and 2.3% YoY — back into positive YoY territory. Asking rents moved with it: $2.93K, up 5.6% MoM.
Landlords could do that because the structural picture hasn't changed. Active listings sit at 2,159 — up 5.2% MoM, but still down a sharp 15.9% YoY — and months of supply is just 1.95. Properties lease in 41 days at 97.5% of original, the tightest execution of any segment.
The volume side is softer: closed leases at 1,116, down 2.5% MoM and 6.1% YoY, with new listings at 1,637 (+8.0% MoM, -7.1% YoY). Fewer leases are getting done — but the ones that do are getting done fast and near ask.

Key Lease Metrics:
Active listings: 2,159 (+5.2% MoM, -15.9% YoY)
New listings: 1,637 (+8.0% MoM, -7.1% YoY)
Closed leases: 1,116 (-2.5% MoM, -6.1% YoY)
Average list price: $2.93K (+5.6% MoM)
Average leased price: $2.6K (+4.8% MoM, +2.3% YoY)
For renters: the negotiating room that briefly appeared has mostly evaporated. With under two months of supply, good units still go fast and go near ask. For investors: Collin County rental stock is down nearly 16% from a year ago. That scarcity is protecting occupancy, speed, and now rate.
The Bottom Line
If May was about buyers acting on their leverage, June is about the other side of every table deciding what to do about it.
New construction: builders reversed the price cut and cut listings instead. Ask is up 4.1% MoM, supply is throttled to 3.4 months, but 72 days on market and 92.8% of original say the leverage didn't disappear — it moved back to the closing table.
Resale: this is the buyer's market. 5,159 actives, 5.8 months of supply, list prices down 3.2% MoM. Sellers who cut are getting 44-day closings at 95.8% of original. Sellers who don't are getting inventory.
Lease: landlords reclaimed the rate. Rents up 4.8% MoM and positive YoY on supply that's still 15.9% thinner than last year. Tenants lost the opening they got in May.
The through-line for the year is intact and it lives in resale: rates 68 basis points lower, the deepest selection Collin County has posted, and pricing below last June. New construction is asking more and taking longer. Lease is tightening back up. But if you're buying a resale home in Collin County right now, June handed you the best combination of rate, choice, and price this market has produced in a while.
Important Note:
This analysis is based on data from NTREIS (North Texas Real Estate Information Systems) as of May 31, 2026. Market conditions can change rapidly, and this report is intended for informational purposes only. It should not be considered a guarantee of future market performance.


